The 2024 Super Bowl in Google Search Trends

Uncategorized | 0 comments

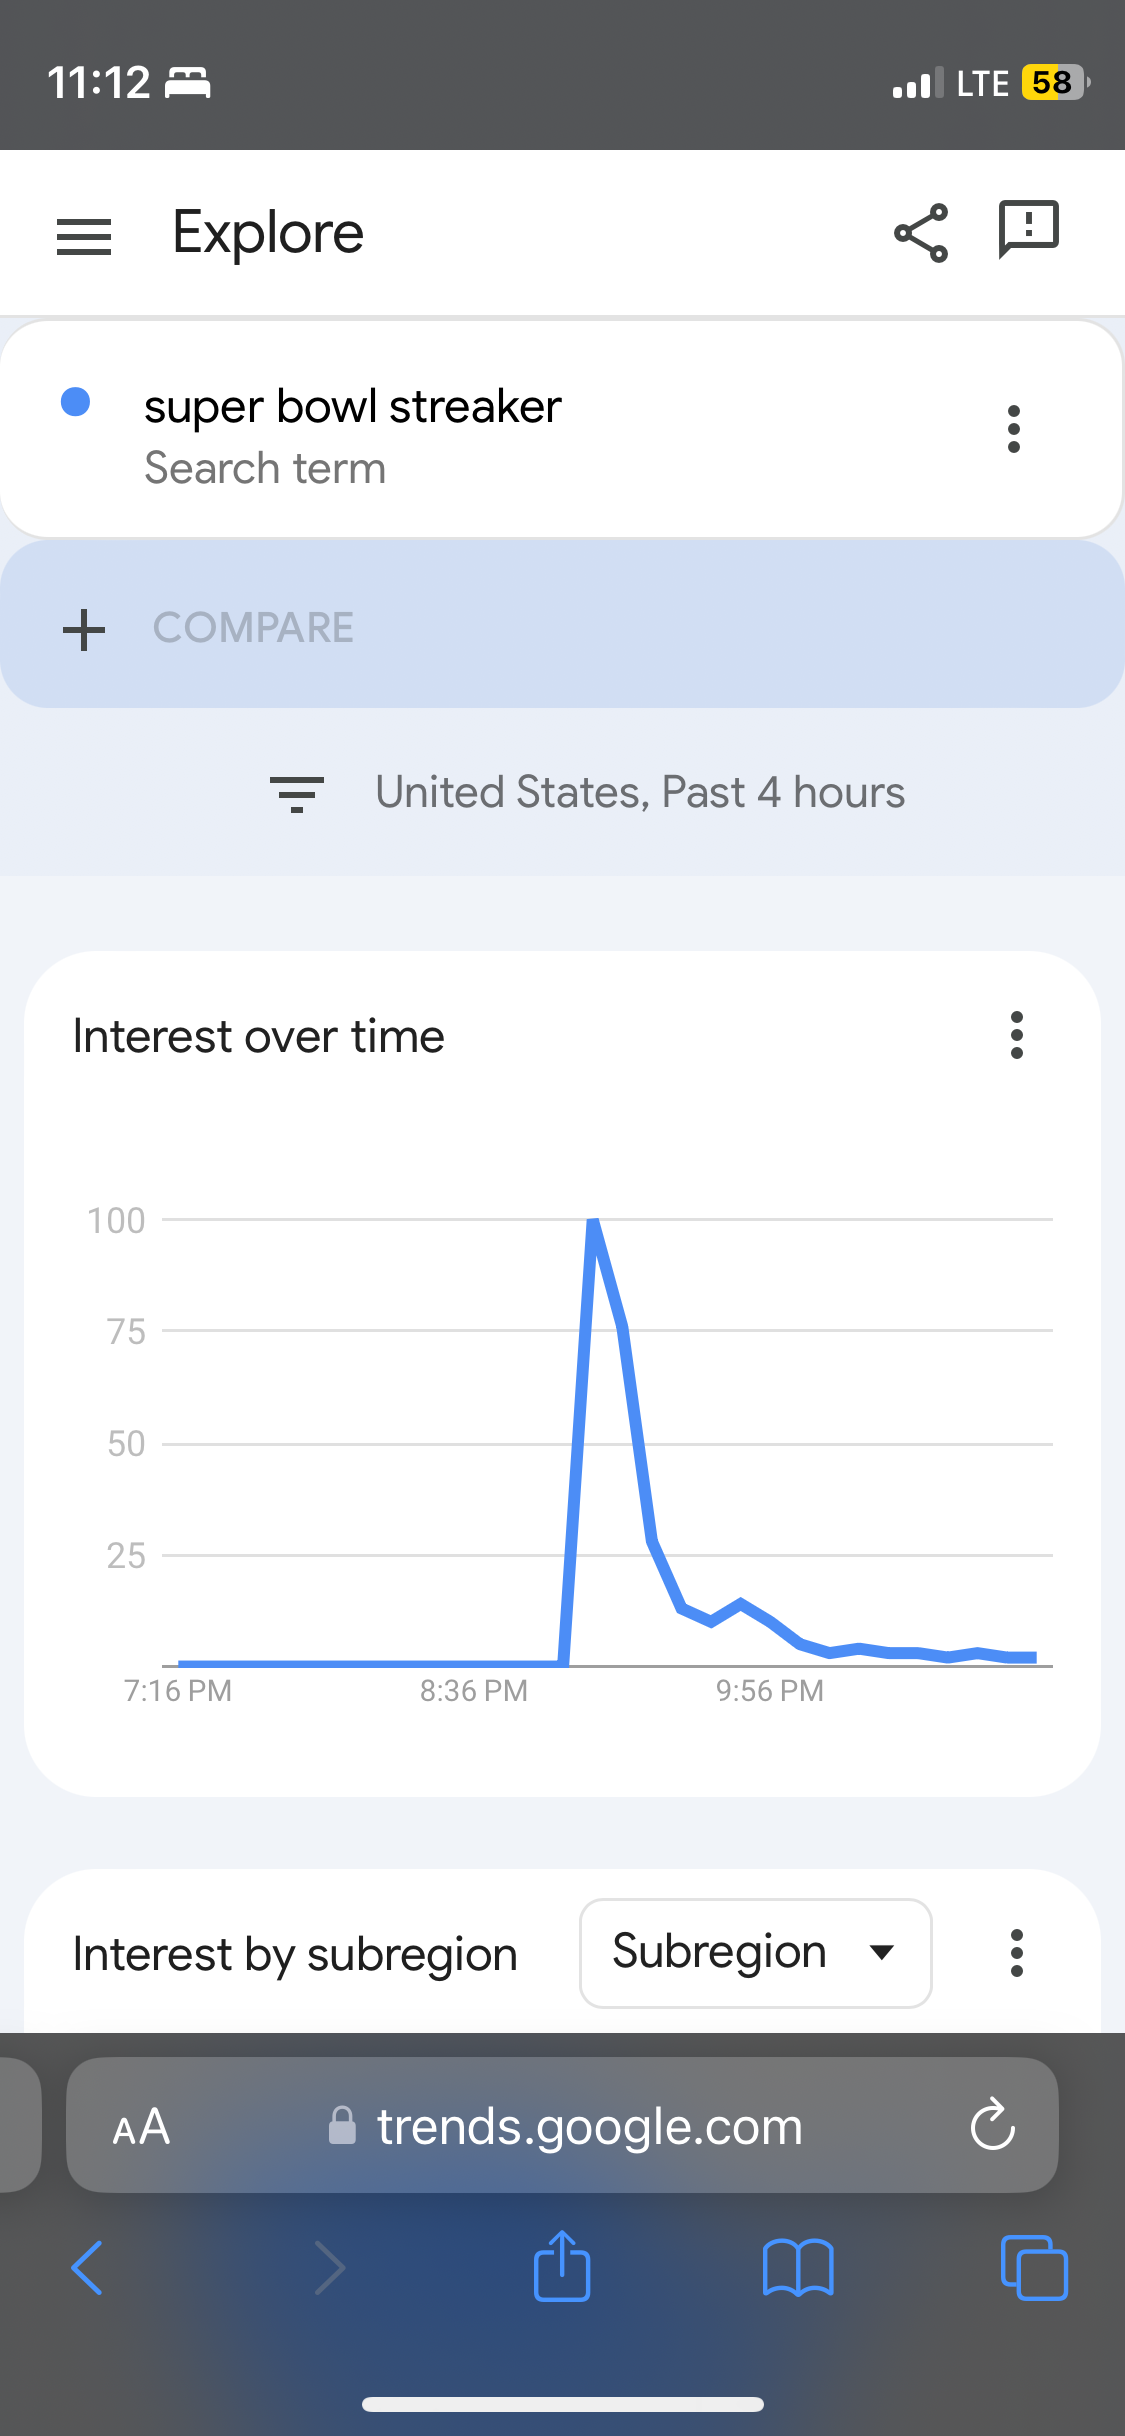
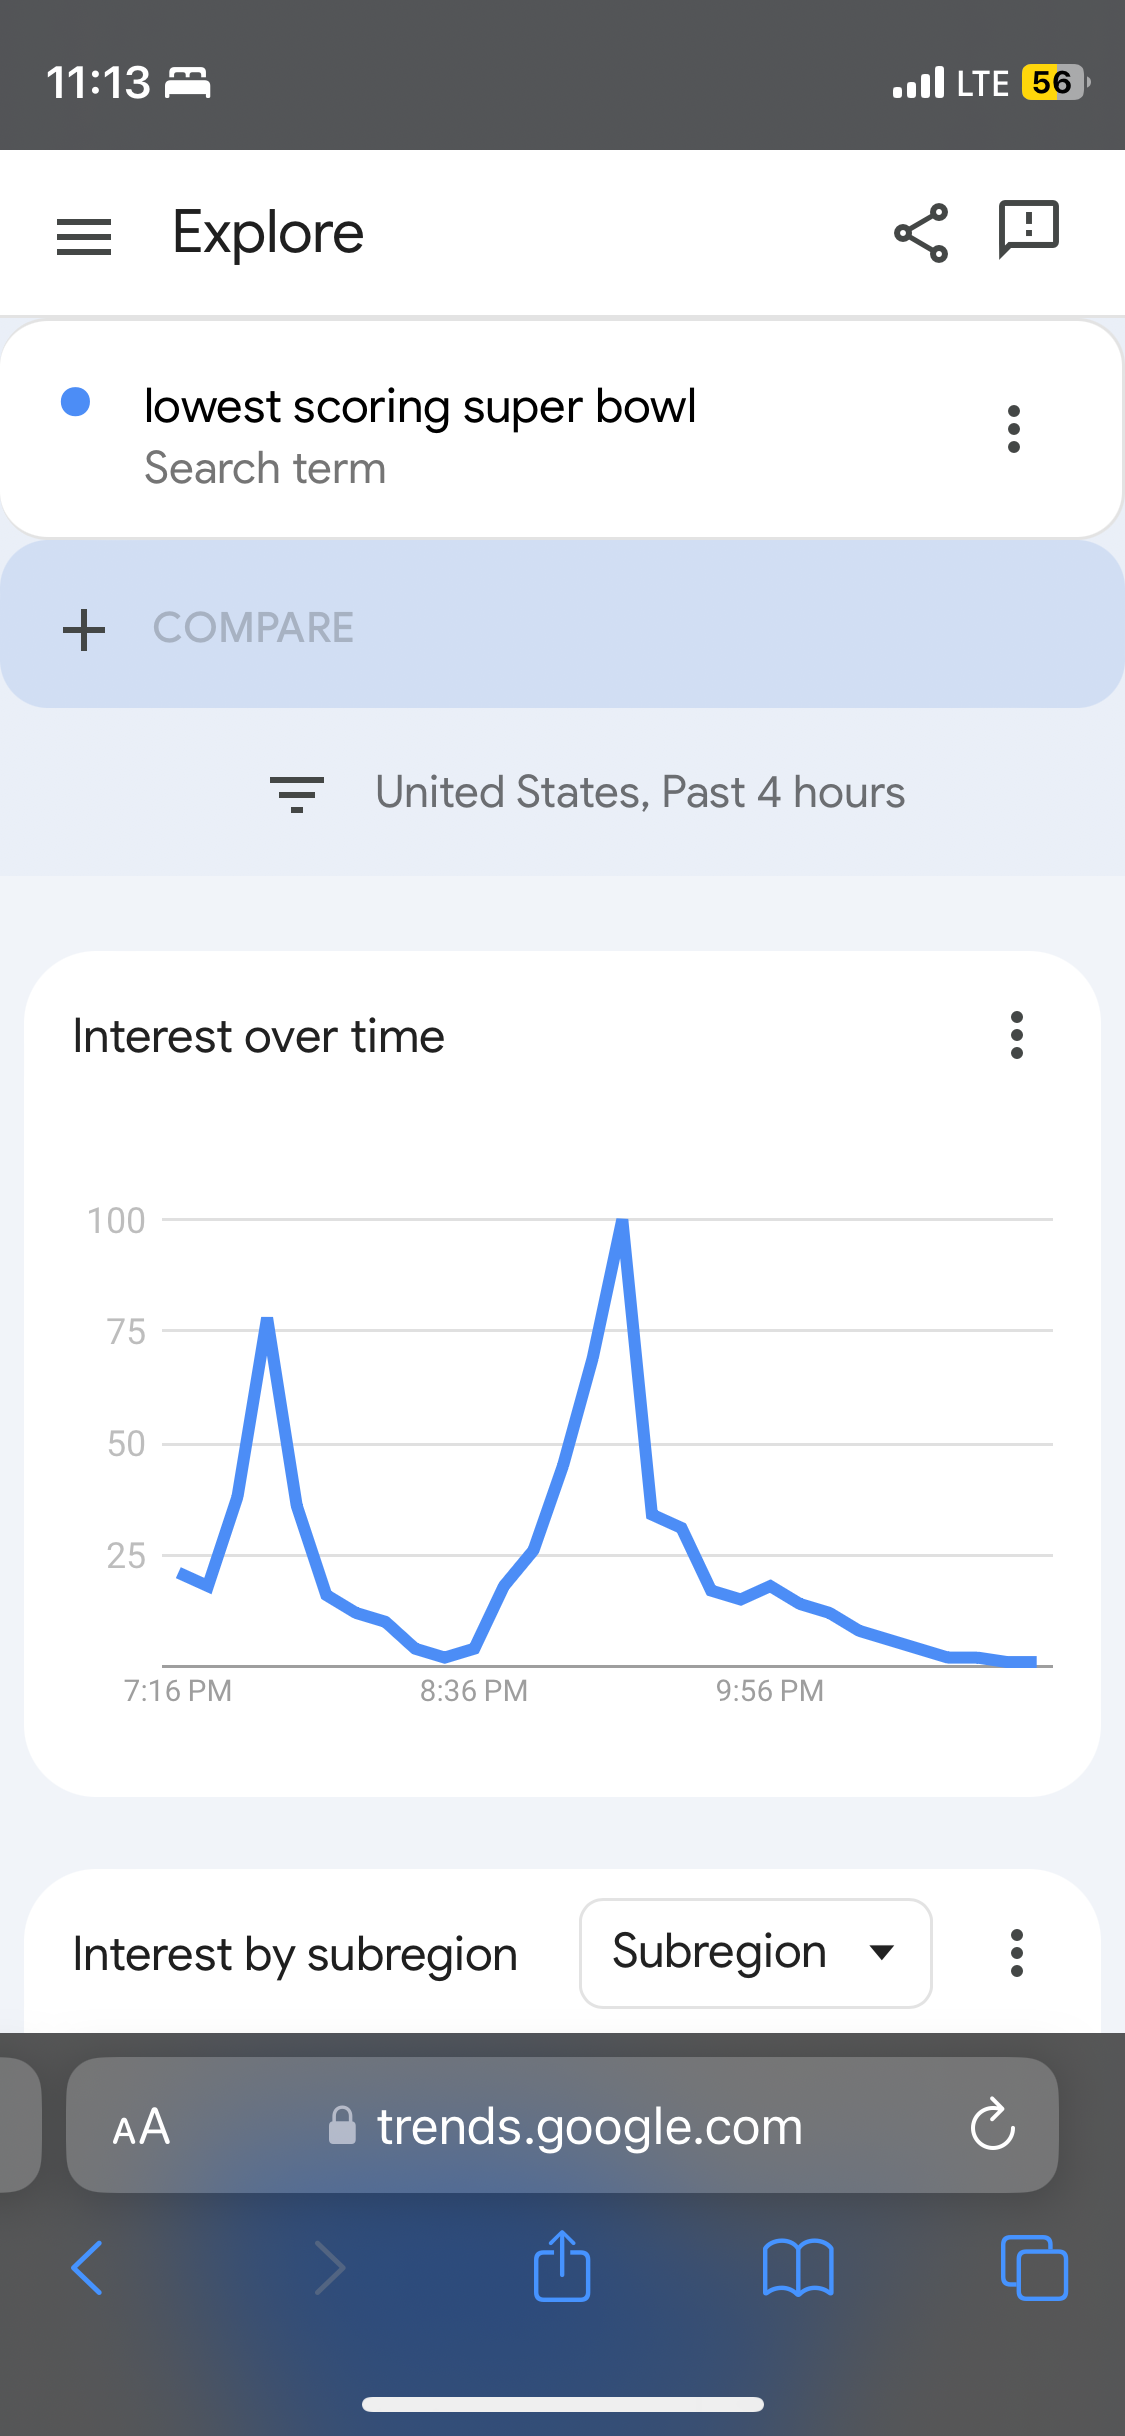
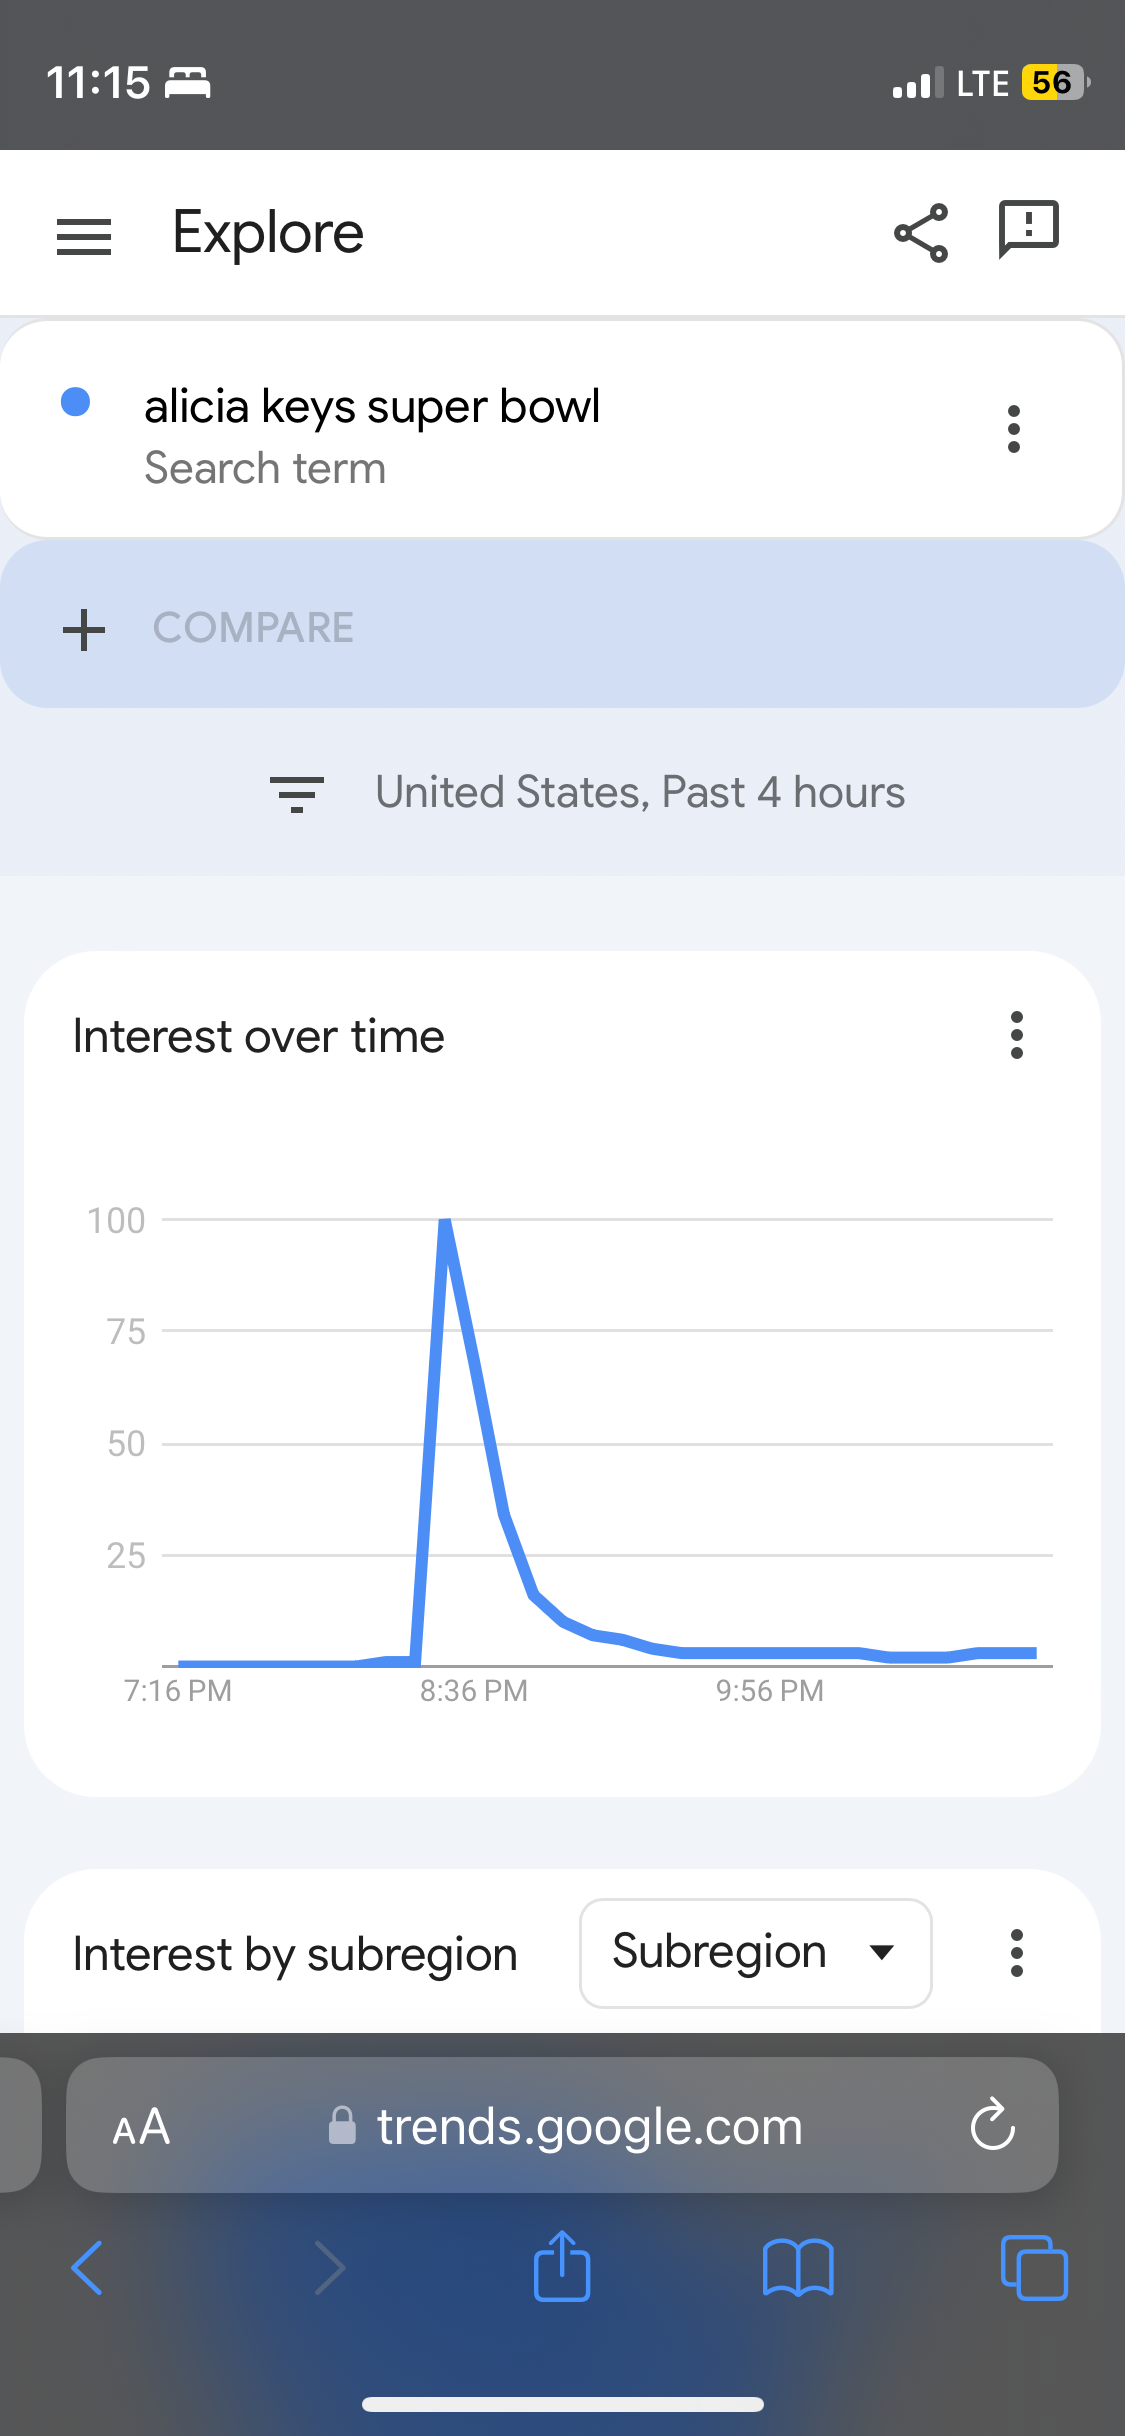
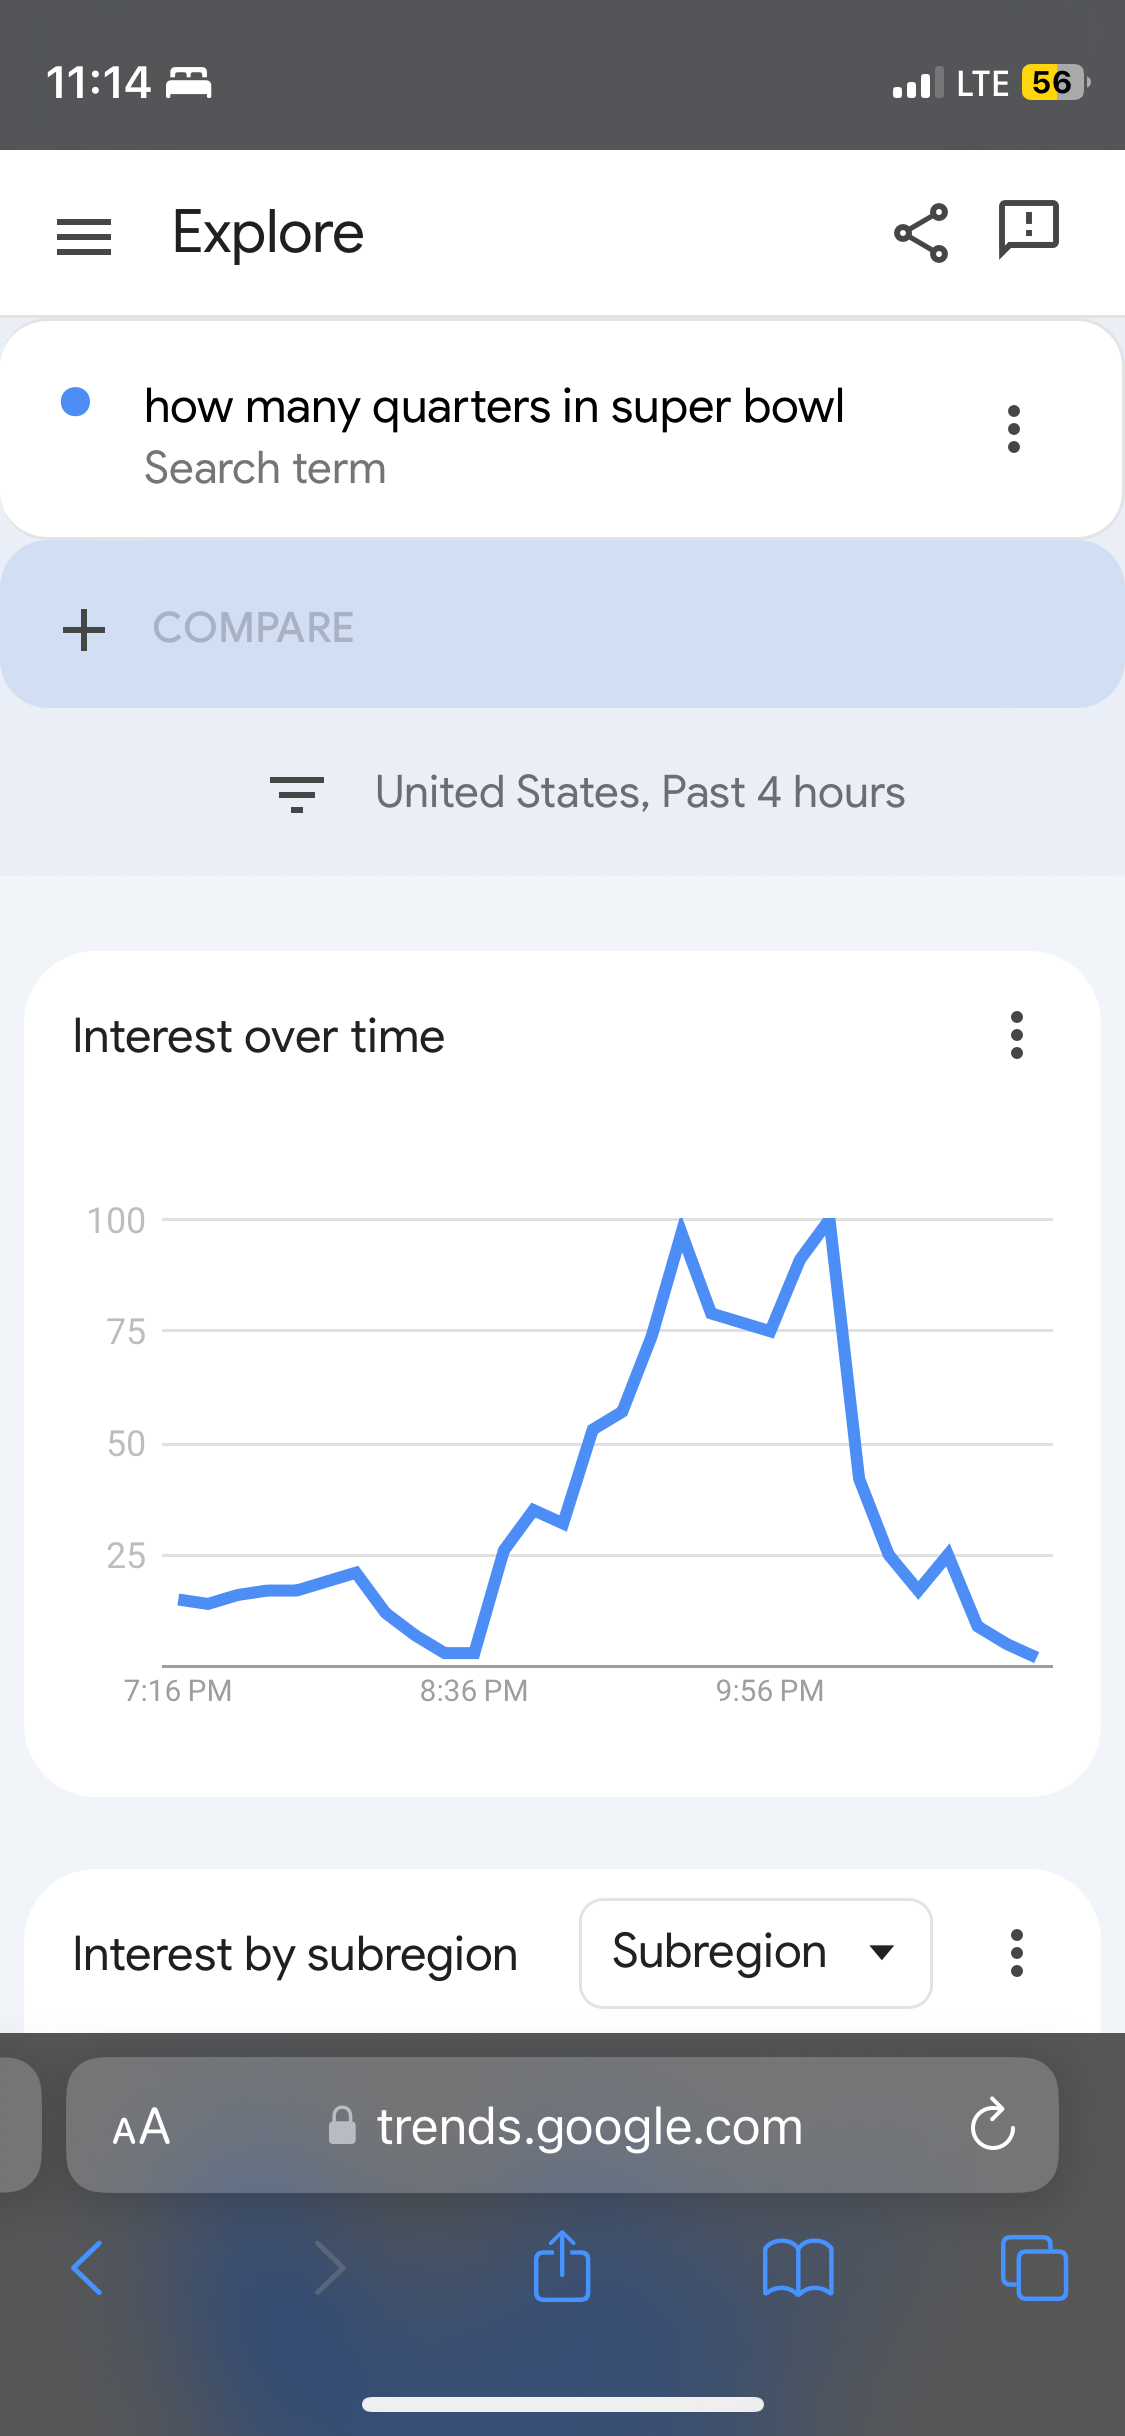
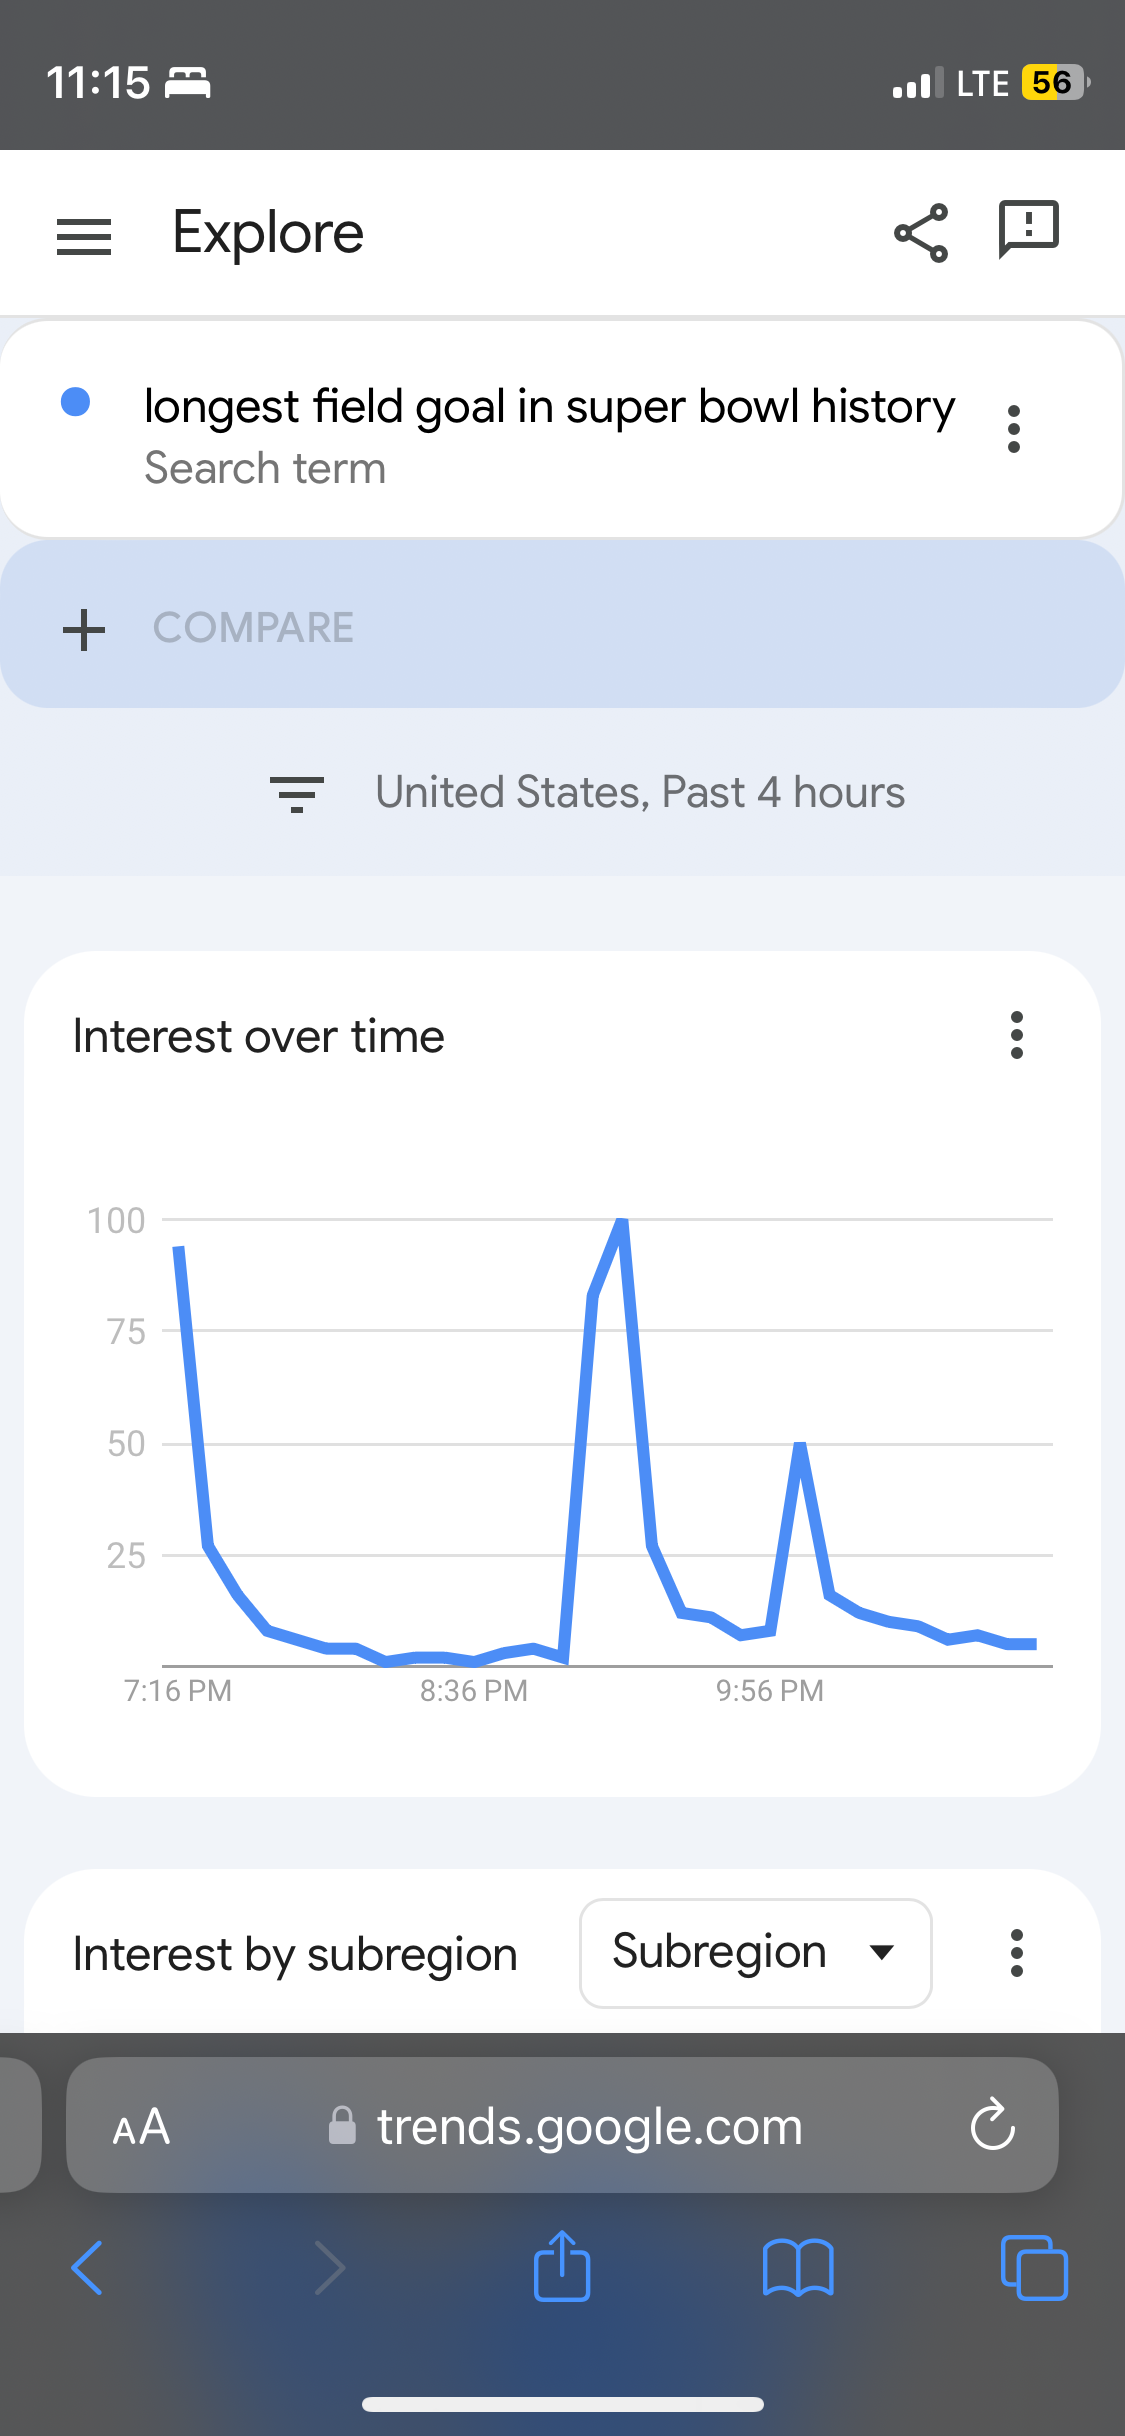
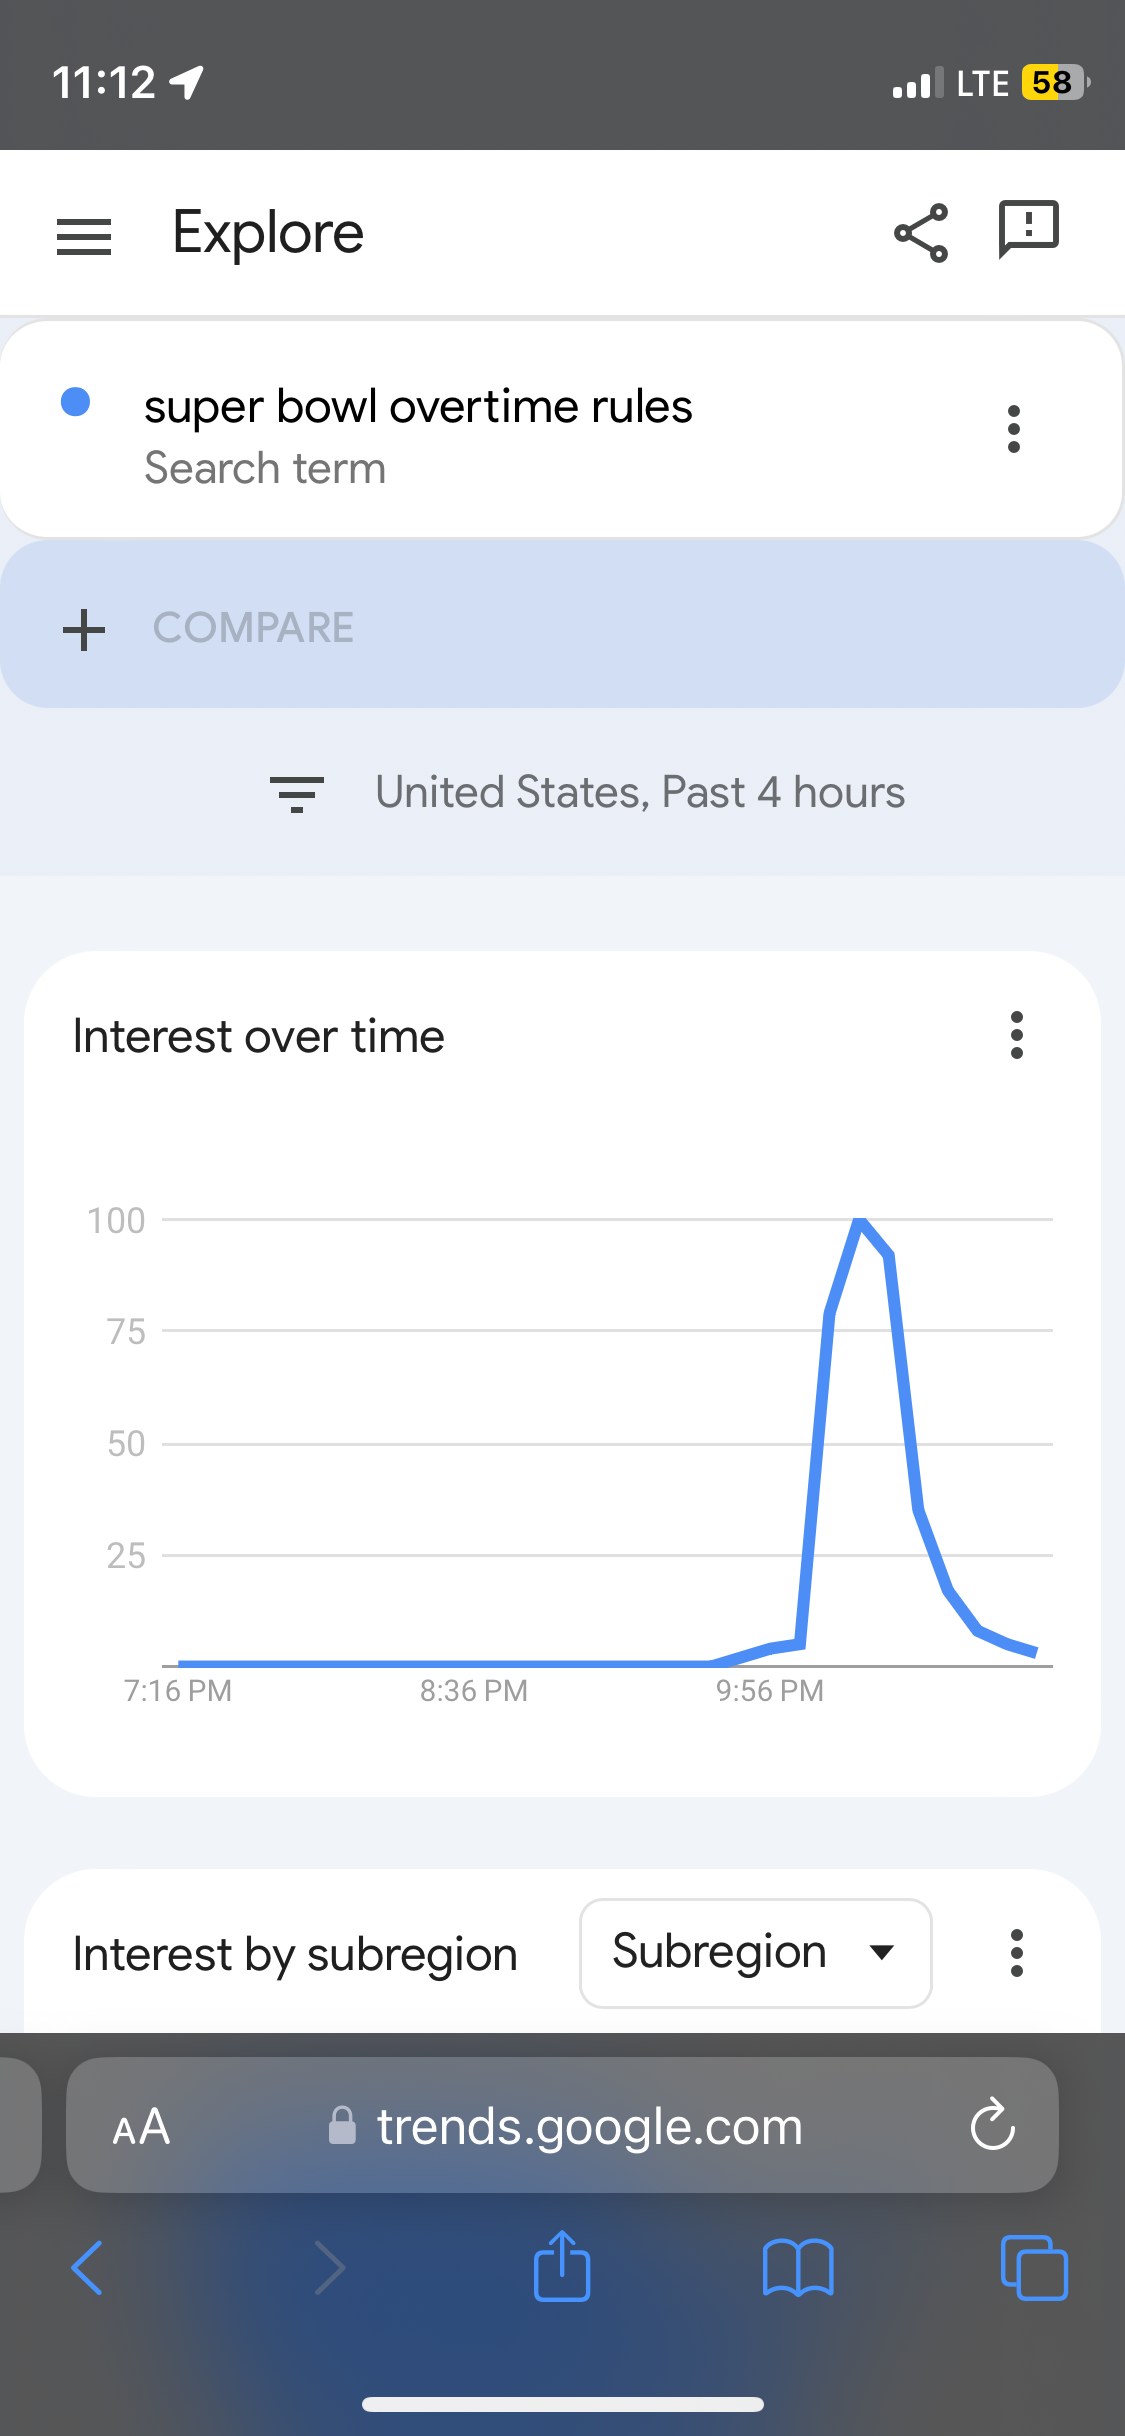
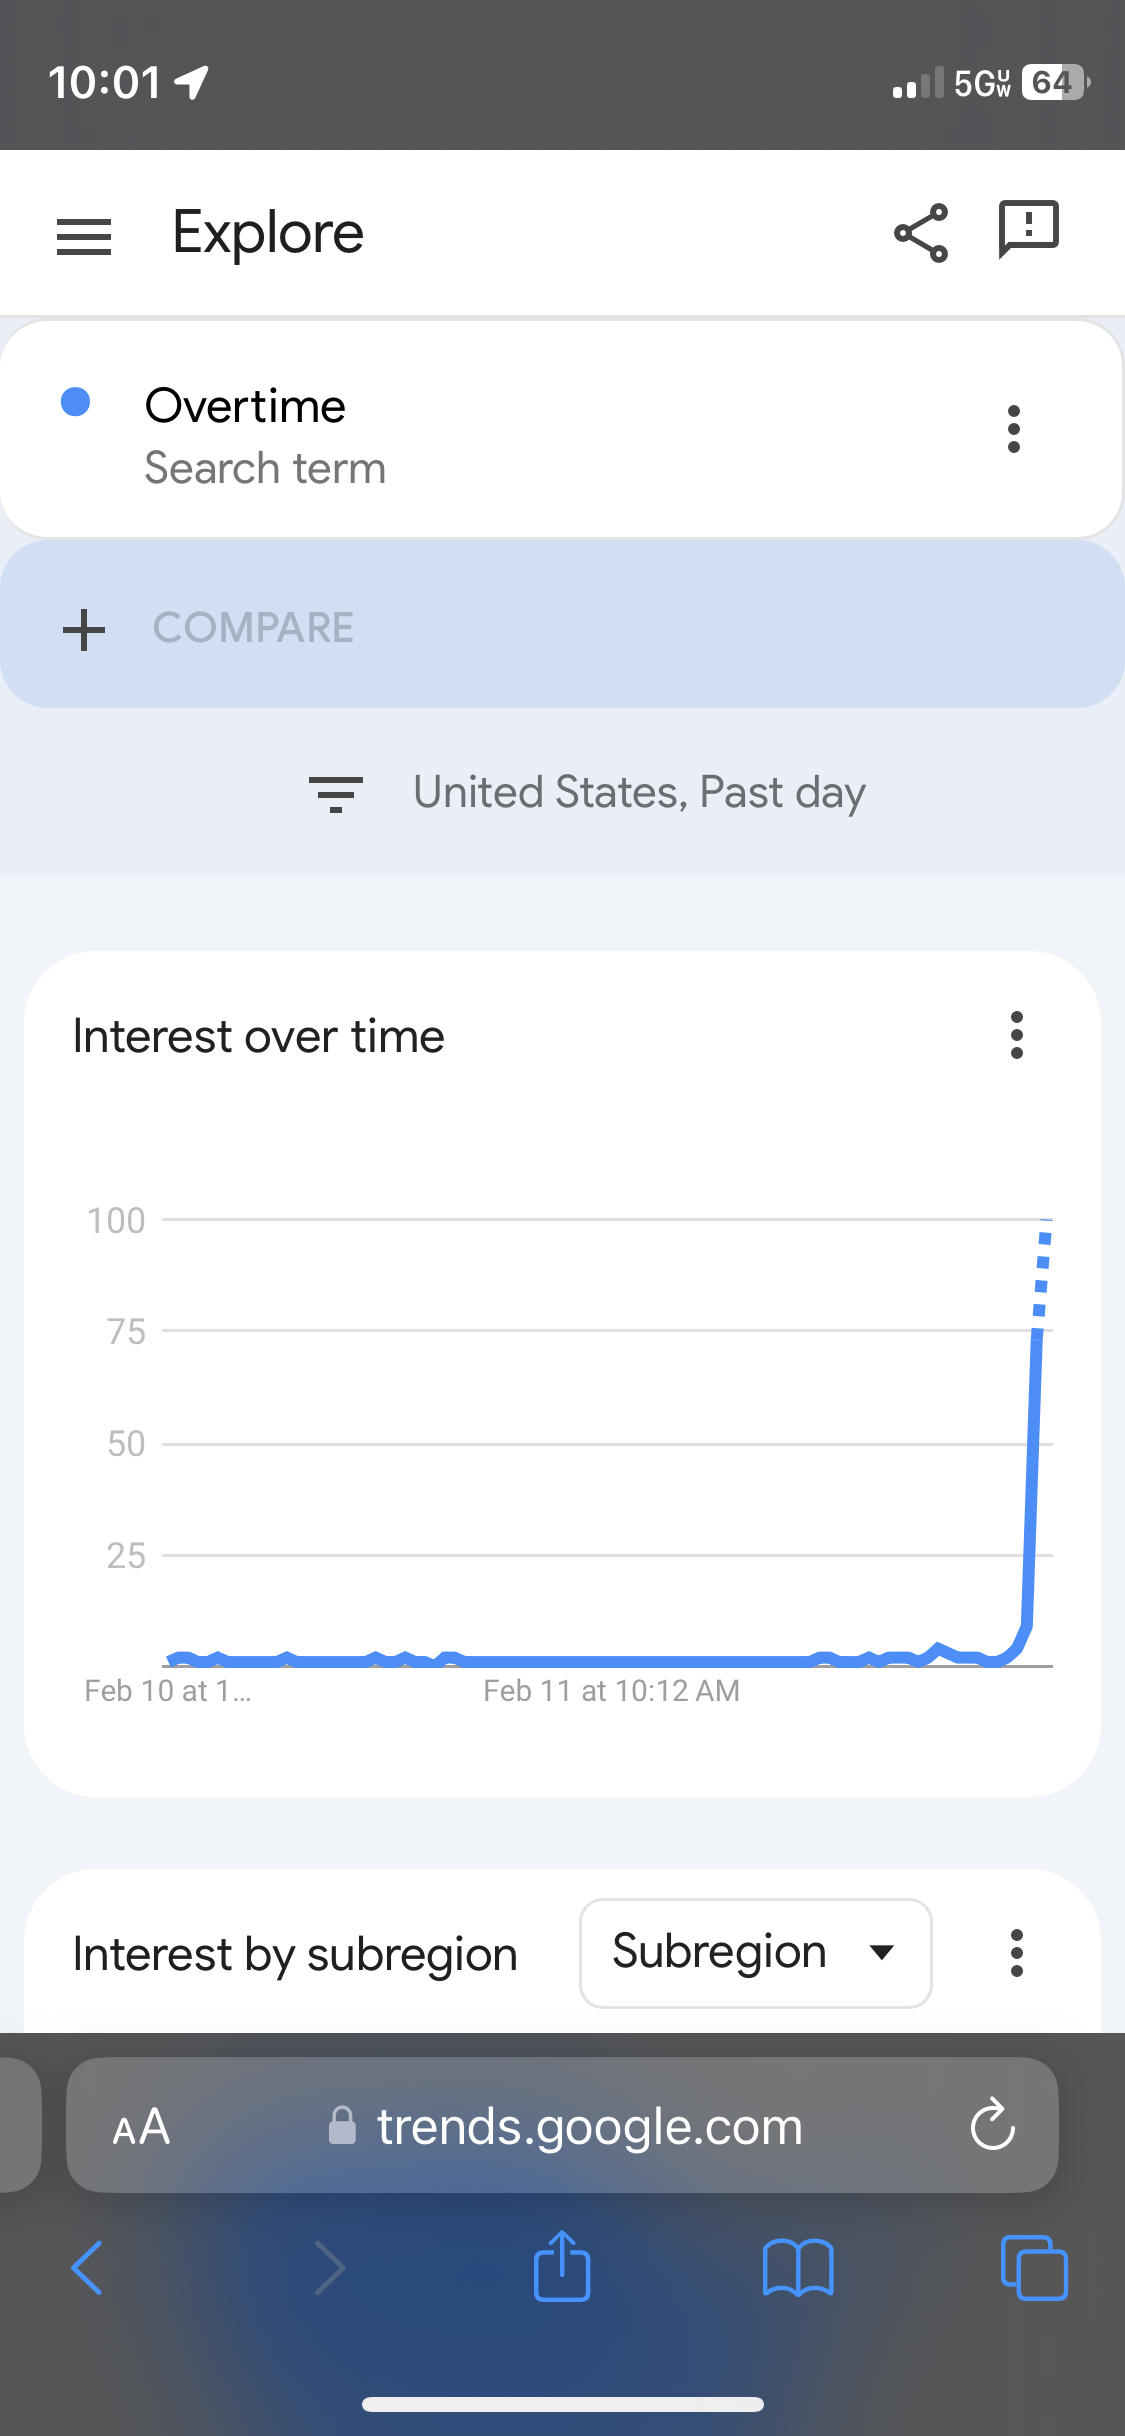
Google Trends shows the interest in specific search terms over time.

Here are some of the top search questions during the 2024 Super Bowl.

Screenshot of a Google Trends search for "super bowl streaker" showing a line graph of interest over time in the United States for the past 4 hours. The graph displays a sharp peak indicating a sudden increase in searches around 8:36 PM, followed by a rapid decline. The interface includes options to explore further and compare with other search terms.
Screenshot of Google Trends on a mobile device showing search interest for the term "lowest scoring super bowl" in the United States over the past 4 hours. The line graph peaks sharply indicating a surge in search interest around 8:36 PM, with two smaller peaks before and after this time. The rest of the graph shows a lower level of interest. Below the graph, there is a section titled "Interest by subregion" which is not expanded in the image. The website address trends.google.com is visible at the bottom.
Screenshot of a Google Trends search result for "alicia keys super bowl" showing a spike in search interest over time. The graph indicates a peak in searches around 8:36 PM, with interest declining shortly after. The timeframe is set to the past 4 hours in the United States. There is also a section titled "Interest by subregion" below the graph, indicating further details are available by region.
Screenshot of a Google Trends search result for the query "how many quarters in super bowl" showing a line graph of interest over time in the United States for the past 4 hours. The graph peaks sharply indicating a high volume of searches around 9:56 PM, then declines. The interface also includes options to compare with another search term and to view interest by subregion.
Screenshot of a Google Trends search for "longest field goal in super bowl history" showing a line graph of interest over time in the United States for the past 4 hours. The graph displays two significant spikes in search interest, one peaking sharply around 8:36 PM and another smaller peak around 9:56 PM. The rest of the graph shows relatively low interest. Below the graph is a section titled "Interest by subregion," indicating further details available by region. The website address trends.google.com is visible at the bottom.
Screenshot of a Google Trends search result for "super bowl overtime rules" showing a spike in search interest over time. The graph peaks sharply indicating a high volume of searches in a short time frame within the past 4 hours in the United States. The timeline at the bottom of the graph indicates the peak occurred around 9:56 PM. There is also a section titled "Interest by subregion" below the graph, suggesting additional detailed data is available. The website address trends.google.com is visible at the bottom.
Screenshot of a Google Trends mobile interface showing a sharp increase in search interest for a term over time in the United States, within the past day. The line graph indicates a baseline level of interest with a sudden spike to the maximum value towards the end of the displayed timeframe. The exact search term is not visible. Below the graph, there is a section titled 'Interest by subregion' which is not expanded in the image. The website address trends.google.com is visible at the bottom.

0 Comments

What's your $0.02?

This site uses Akismet to reduce spam. Learn how your comment data is processed.