Coding with o1-preview

Coding with o1-preview

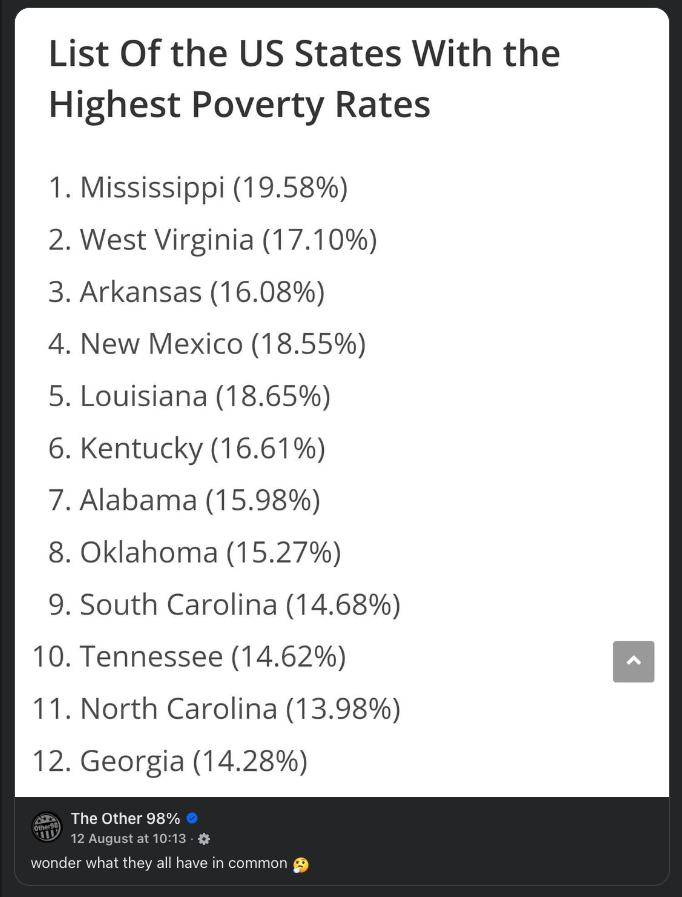
o1-preview is the most recent model released by OpenAI as of this writing. Less a model than a GPT wrapped in the API that runs your query through multiple steps on OpenAI’s end instead of you doing it yourself.

I think they may have made adjustments, because it has been getting better for me.

I’ve used o1-preview extensively for a Python script to search a disk for duplicate files. It is 443 lines of actual code at this point. The script is moderately complex, allowing users to choose originals based on path, a preferred list of directories, or within a specific directory, delete duplicates, have a dry run, and more. These features require tracking a small set of variables from start through finish to insure proper processing.

Not a big deal for most humans, but something I’ve found LLMs to struggle with in the past. It’s been like they can only keep track of the changes in one or two of the most recent functions they’ve seen. o1 doesn’t seem to have this problem.

My conversation is over 8,000 lines long, and with every change it has properly tracked the context of the entire script at once. Any changes I’ve asked it to make that require updating multiple functions its handled perfectly. It’s accuracy has been very high, with only a single mistake made that I’ve spotted.

This isn’t revolutionary, but it is a major step forward, and I believe will allow much faster development of simple to moderate-complexity scripting, even for non-devs.

Not the Way to M&A

As a small business, we work with a lot of other local small businesses. For many owners, exiting (selling) is essentially their retirement plan. I fully believe owners should be able to exit their business at a healthy price.

But how they exit matters.

Last week I recieved an email from a business we’ve partnered with for well over a decade. TThey handle both my personal and business accounts. I noticed that the email said, “A [national brand] company.”

Huh?

Well, this business had sold to a national company without notifying anyone.1 Nothing on their blog, nothing on their social. media, no email announcements. Just that small change in their email signature and attachments. I suspect this was required because the industry is regulated, and they need to disclose who ultimately provides the product.

The new owners had a small press release where they quote the original owner/founder:

“Our clients were at the forefront of our decision to join [national brand] due to today’s ever changing insurance environment,” says [former owner] Principal and Founder of [local small business]. “… and we are excited to bring world-class resources and expertise with our same local support to the business-owners, non-profits and individuals we serve.”

If clients like me were truly at the forefront, we would have been informed about the acquisition. It wouldn’t have been hidden.

M&A deals are complicated, I get that. It’s important for owners to receive fair value for what they’ve built and the risks they’ve taken. But these “thief-in-the-night” acquisitions leave a bad taste in my mouth.

I have no timeline for exiting my own firms, but when that day comes, I hope I am proud enough of the transition to celebrate it with my clients and employees, rather than hide it

  1. As far as I can tell. ↩︎
ConnectWise Purchases Axcient

ConnectWise Purchases Axcient

On September 10th, 2024 ConnectWise announced they purchased Axcient. I’m neutral on this having very limited experience with ConnectWise. Their announcement email is here.

I suspect Axcient was in need of capital. Over the last couple of years many MSPs moved from Datto BCDR and SaaS backups to Axcient which offers essentially the same thing. While Axcient’s GUI is nowhere near as streamlined. as Datto’s, they offer lower pricing, better terms and better support. Before the acquisition by Kaseya, Datto would have won in those areas, except pricing, where they always demanded a premium.

I’m entirely OK with another conglomerate arising in the channel to challenge Kaseya. I’m not reflexively anti-Kaseya. We use many of their products and we have a good relationship with their director-level management. However, it isn’t healthy for the ecosystem to lack competition, not just in terms of products, but in terms of vertical integration and deep-pocketed investors.

Misleading Facebook Post: US Poverty is Driven by Politics

Misleading Facebook Post: US Poverty is Driven by Politics

There is a Facebook post going around that deceptively shows US states by poverty to imply that Republican politics introduce poverty. Here is the post/list:

A screenshot displaying a list titled "List Of the US States With the Highest Poverty Rates." It enumerates twelve states with their respective poverty rates in descending order: Mississippi at 19.58%, West Virginia at 17.10%, Arkansas at 16.08%, New Mexico at 18.55%, Louisiana at 18.65%, Kentucky at 16.61%, Alabama at 15.98%, Oklahoma at 15.27%, South Carolina at 14.68%, Tennessee at 14.62%, North Carolina at 13.98%, and Georgia at 14.28%. The list is followed by a comment from "The Other 98%" with a timestamp indicating "12 August at 10:13" and a pondering emoji, stating "wonder what they all have in common 🤔".

This list cuts off arbitrarily to make a point. While there may be truth in the larger picture, selectively using data to make your point isn’t cool.

First, let’s expand the list1:

State or territoryPopulationPopulation under
poverty line
Poverty rate
 Puerto Rico3,227,4571,400,95843.41%
 Mississippi2,883,074564,43919.58%
 Louisiana4,532,187845,23018.65%
 New Mexico2,053,909381,02618.55%
 West Virginia1,755,591300,15217.10%
 Kentucky4,322,881717,89516.61%
 Arkansas2,923,585470,19016.08%
 Alabama4,771,614762,64215.98%
 District of Columbia669,089103,39115.45%
 Oklahoma3,833,712585,52015.27%
 South Carolina4,950,181726,47014.68%
 Tennessee6,603,468965,21314.62%
 Georgia10,238,3691,461,57214.28%
 Texas28,013,4463,984,26014.22%
 Arizona7,012,999990,52814.12%
 North Carolina10,098,3301,411,93913.98%
 Michigan9,753,5411,337,25613.71%
 Ohio11,350,3781,546,01113.62%
 New York19,009,0982,581,04813.58%
 Florida20,793,6282,772,93913.34%
 Missouri5,942,813772,99213.01%
 Indiana6,491,632838,14912.91%
 South Dakota849,910108,86312.81%
 Montana1,036,490132,47612.78%
 Nevada2,987,817381,69512.78%
 California38,589,8824,853,43412.58%
 Oregon4,096,744506,55812.36%

There is no shortage of blue states in that list.

The overall US poverty rate is 13.15%, and guess what? There are plenty of red states below that. Here is the visualization:

United States map showing the percentage of population below the poverty line by state, based on the American Community Survey from 2016 to 2020. States are color-coded to indicate poverty levels: dark red for 18% or more, red for 16% to 18%, orange for 14% to 16%, light orange for 12% to 14%, and pale orange for less than 12%. The overall percentage of Americans living below the poverty line is 13.1%. The top five states with the highest poverty rates are Mississippi at 19.6%, Louisiana at 19.0%, New Mexico at 18.4%, West Virginia at 17.1%, and Kentucky at 16.3%. The bottom five states with the lowest poverty rates are New Hampshire at 7.2%, Utah at 8.9%, Maryland at 9.0%, Minnesota at 9.3%, and New Jersey at 9.5%.

But that still doesn’t tell a good story, here is povery by county:

Heat map of the United States showing the percentage of the population living below the poverty line by county, based on data from the American Community Survey 2016-2020. Darker shades of red indicate higher percentages of poverty. The map legend indicates that red tones range from light (less than 5% poverty) to dark (30% or more poverty). The overall percentage of Americans living below the poverty line during this period is noted as 13.1%. The image also includes a reference to New York City for geographical context.

With the data provided you could conclude that poverty is driven by politics.

Atlanta has a poverty rate of 17% compared to 12.3% for GA overall even though Atlanta is blue.

Or you could conclude that it’s due to race.

Or you could conclude that it’s due to geography.

This isn’t even adjusted for the cost of living!

This article from Time shows CA, FL, MI and NY as the states with the four highest poverty rates after such adjustments.

Like nearly every political issue in the news today the data is nuanced and the causes are nuanced.

P.S. You can find fuller data on the adjusted measure (SPM) at the US Census Bureau – https://www.census.gov/topics/income-poverty/supplemental-poverty-measure.html

  1. Via Wikipedia which takes it from the US Census Burea ↩︎